 IMM Instrument Guides
 IMM Instrument Guides
Quick evaluation guide
Open the sample of interest.
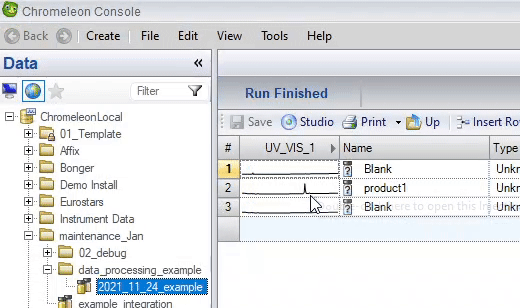
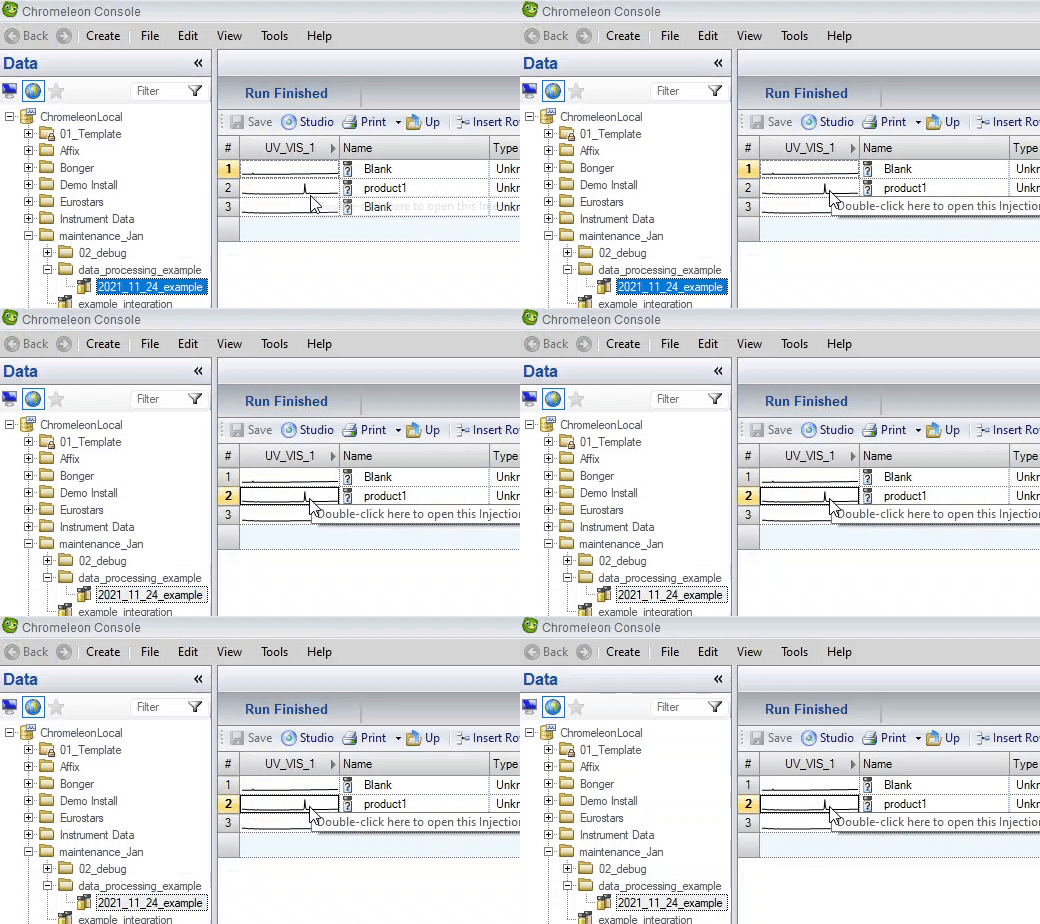
opening the sample (double left click)
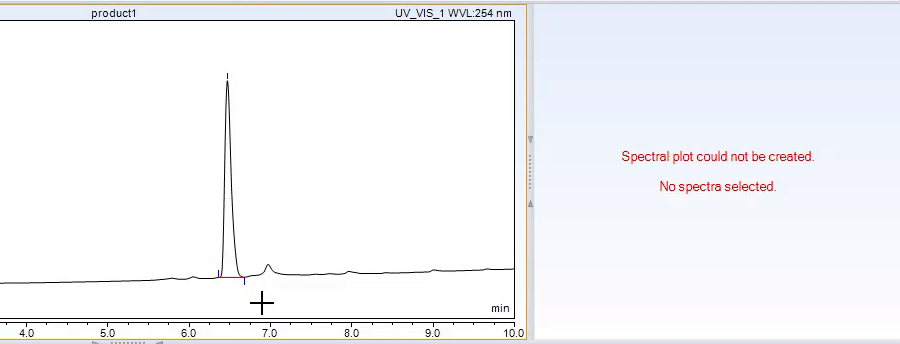
Select peaks which you want to integrate.
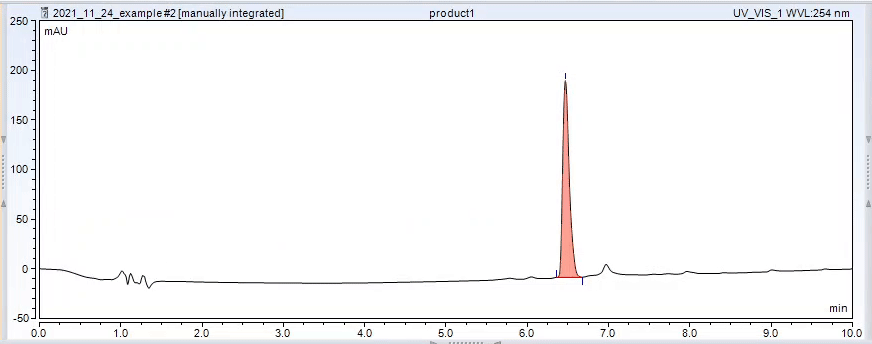
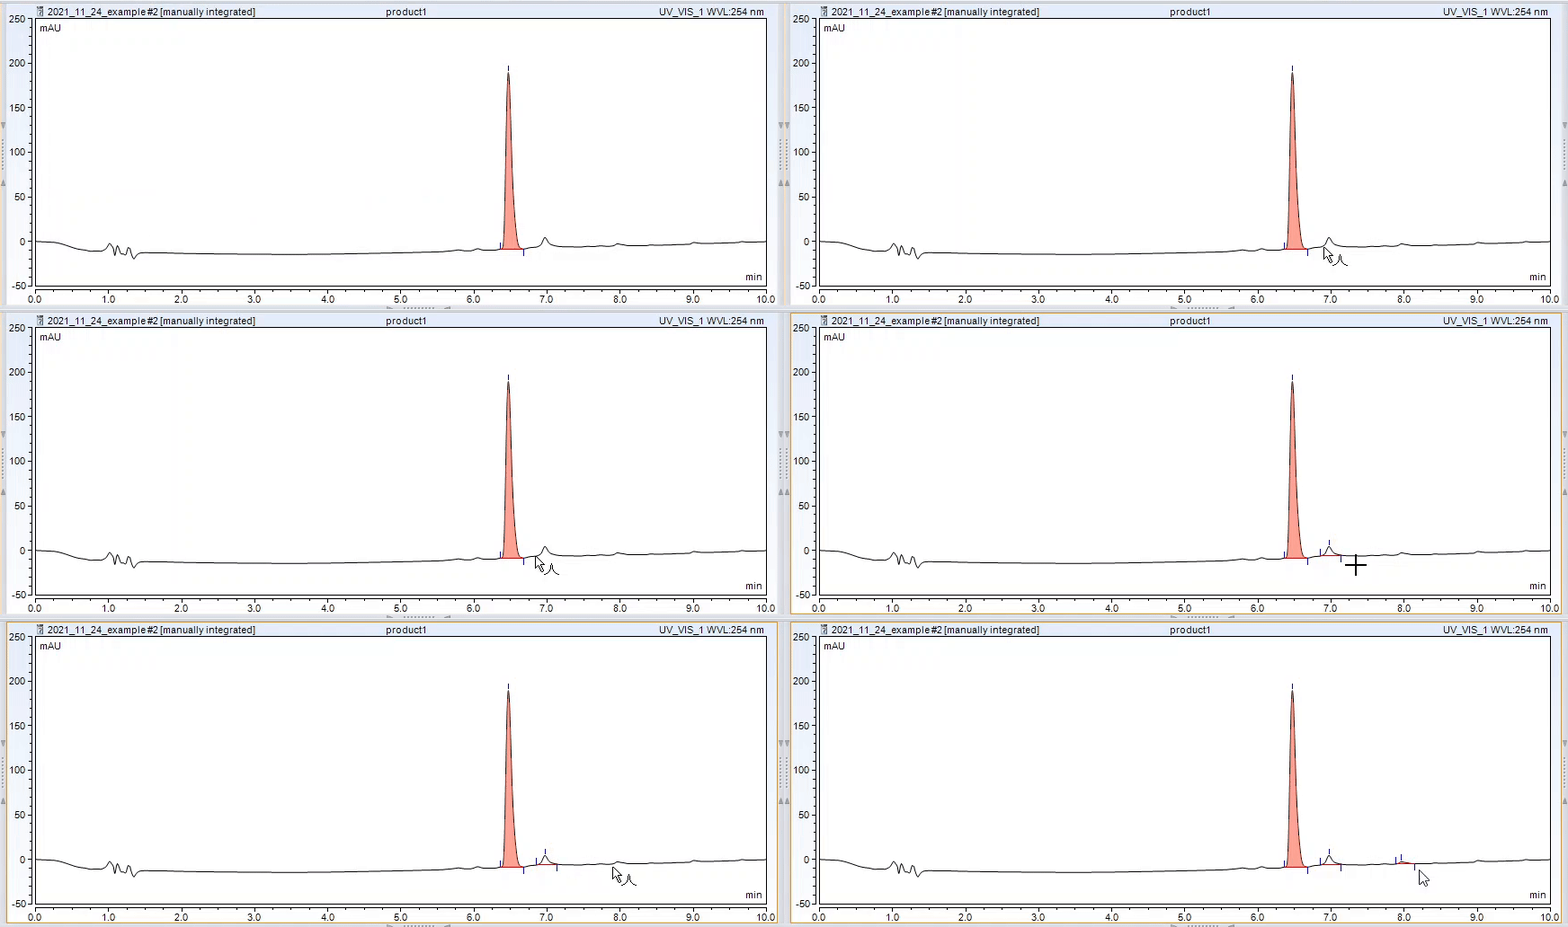
peak selection (left click onto line and drag)
You can see an M/Z spectrum of the scan which took place at the maximum of the peak by clicking on an integrated peak.
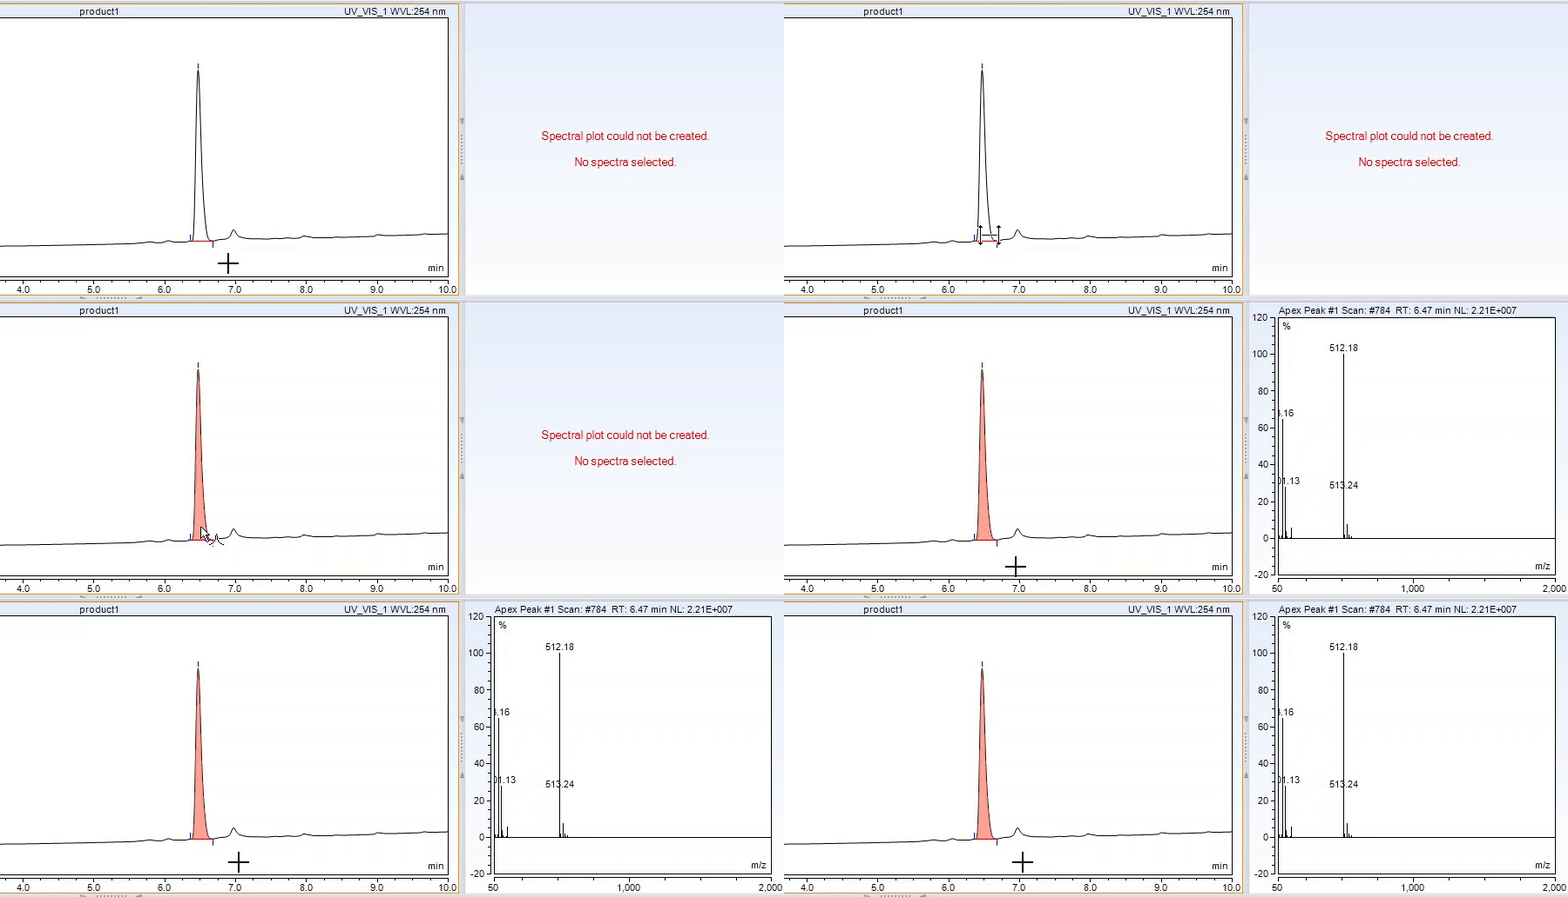
show m/z spectrum (left click into the peak)